


 Alysse Merila
 Tina Murphy
Meridian’s 2025 Retail Incentive Trends Report summarizes the current retail environment and trends, highlighting the direction companies are taking regarding incentive design. Overall, results are consistent with the prior year’s study, showing little year-over-year change from 2023-2024.
The study includes 109 retail and restaurant companies within the Consumer Discretionary and Consumer Staples GICS industry sectors.
Highlights
Annual Incentive Plan Design Practices
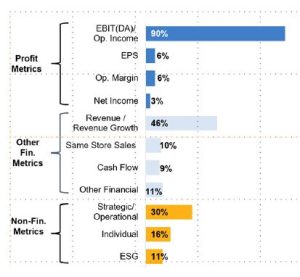
• Annual incentive designs continue to be relatively evenly split between the use of two financial metrics (45%) versus a single financial metric (37%) in the annual incentive plan.
• All companies used at least one profit metric (e.g., EBIT(DA), operating income, operating margin, EPS, or net income), often paired with a revenue/sales metric.
• Nearly half (48%) of companies included at least one non-financial metric, slightly down from 52% in 2023.
• Of those companies making changes in 2024 (31%) the most common changes were reductions in the weighting of profit metrics in favor of revenue/sales metrics and eliminating ESG metrics from the plan design (the latter being consistent with trends observed in other industry sectors).
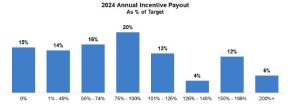
• The most prevalent payout range was 1-25% at threshold and 200% at maximum.
While annual incentive plan designs remained relatively consistent in 2024, the handful of changes point to a few general themes that we observed in the industry. The increased weighting on revenue/sales metrics aligns with many focusing on a return to growth strategy rather than solely bottom line. Additionally, as criticism of specific ESG practices strengthened, many companies chose to eliminate the formal ESG metric within their plans (11% vs. 18% prior year). Given the current political landscape, we would expect that percentage to continue to decline in 2025 plans.
Annual Incentive Plan Payouts
There was a wide range of payouts for 2024 annual incentive plans across the industry. For the second year in a row, a majority of companies paid below target (64%) with an overall average payout of 83% of target (89% in 2023). Given the impact of tariffs, we expect that 2025 will continue to be a challenging year for annual incentive plan payouts with a wide range of outcomes.
Long-Term Incentive Plan Design and Vehicle Mix Practices
Approximately 22% of companies made changes to the LTI mix in 2024 or 2025 (if disclosed). The most prevalent change was to increase PSU weighting, typically in conjunction with a decrease to RSU or stock option weighting.
• Nearly 90% of respondents used a performance-based vehicle, while 86% used RSUs and only 30% used stock options.
• The average mix of LTI awards for CEOs was 52% PSUs, 36% RSUs, and 12% stock options, with just a slightly lower weighting on PSUs and correspondingly higher weighting on RSUs for other NEOs.
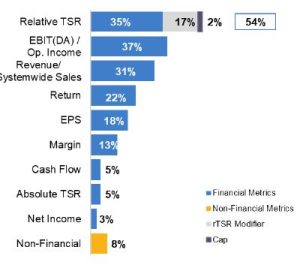
• Relative Total Shareholder Return (rTSR) continues to be the most prevalent metric used in performance-based LTI plans (54%), followed by EBIT(DA)/operating income (37%) and revenue (31%).
― Of those that used rTSR, 65% used it as a standalone metric versus 35% as a modifier.
― 61% of companies that used rTSR used either an Index or an Index Subset (e.g., S&P Retail Select Index) for the comparator group, with the remaining 39% using the compensation peer group or a custom performance group.
― While we had previously observed a shift to requiring above-median rTSR performance for target payout, this year showed that only 21% of companies required above-median performance (e.g., 55th percentile) in order to earn target.
― Slightly more than half (55%) of companies included a payout cap for negative absolute performance (i.e., if absolute TSR over the performance period is negative, payouts are capped at target).
Among retailers with long-term performance-based incentives, the pace of design changes slowed in the most recent year. Only 24% of companies disclosed changes in their incentive structure in 2024, compared to roughly 45% last year. Approximately one-third changed the performance measurement period while another third reduced or eliminated the weighting on earnings-based metrics. In contrast, 14% increased the earnings weighting, suggesting little net year-over-year movement in the prominence of earnings as a measure. External market-based metrics continue to increase in prevalence; 32% of companies increased or newly introduced rTSR into their long-term programs. Given current challenges in the consumer-focused environment and difficulty setting three-year goals, we anticipate companies will continue to add these market-based rTSR measures to compensation programs.
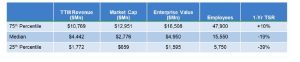
The financial highlights of the 109 companies represented in this study are shown below. All figures are shown as of June 1, 2025.