The menu of industry annual incentive metrics (and some long-term incentive metrics) now includes several instances of ROCE, Cash ROCE, ROIC, estimated wellhead returns, and other non-GAAP measures of investment returns.
Investors may welcome the incentive accountability to financial returns, but will performance against these new benchmarks create better alignment between pay and performance? Should investor capital follow the companies that put the greatest incentives on returns performance?
The Campaign for Returns Metrics
From our observation across the industry, the large majority of these new metrics respond to the unprecedented investor campaign over the past two years to install more returns accountability in incentive compensation scorecards. Investors and industry analysts have accused industry boards and management of paying only for growth (higher production, larger reserve base), rather than for investments that generate value-added returns.
Opinions may differ on whether it was industry management or the investors themselves who both encouraged and demanded growth when commodity prices were high (oil at $100+/bbl, gas at $5+/mmbtu). Arguably, everyone perhaps assumed that financial returns were a “given”, and growth became the primary indicator of value creation.
When oil prices plummeted by 60% and more, that equation certainly flipped. Expected income evaporated, companies reported large losses, and investors lost significant value as stock prices declined.
Some investors place blame on executive compensation. They assert that companies should align substantial incentives with absolute, near-term financial returns. They claim that a returns incentive would instill newfound capital discipline, align pay with performance, and distinguish the better performers from the poorer performers.
Relative Performance for Real Alignment
Returns metrics measured over one- to three-year periods can indeed provide evidence of a company’s good portfolio management, capital discipline, and efficient execution – the foundations of sound E&P management. Returns metrics can also mask important performance outcomes when commodity prices change over time. Beating or missing an absolute returns target might instead be more a function of near-term commodity price changes than management performance.
We believe oil and gas investors should seek companies willing to put substantial compensation at risk based on their future relative performance. Relative performance benchmarks, especially relative total shareholder returns, offer the strongest incentive to create value under any industry conditions.
The past few years featured the worst commodity price environment relative to initial expectations that the industry had experienced in many years. Most E&P companies lost market value over that time. Companies that managed to hold their stock price flat outperformed most of the industry under those conditions.
We believe investor capital will follow the better performers, and move away from poorer performers, whether commodity prices support higher profits or lower profits. Investors will follow and interpret the many industry indicators of value creation – including financial returns – and seek those companies positioned to deliver the best combinations of both financial returns and growth, with sound capital discipline.
Investor sentiment and trading activity will drive stock price movement. Most large E&P companies already place substantial incentive compensation at risk based on relative shareholder returns performance. A typical large-cap industry CEO can have over 35% of total target compensation opportunity riding on relative shareholder returns performance. The stakes are large and the shareholder alignment is strong.
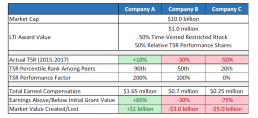
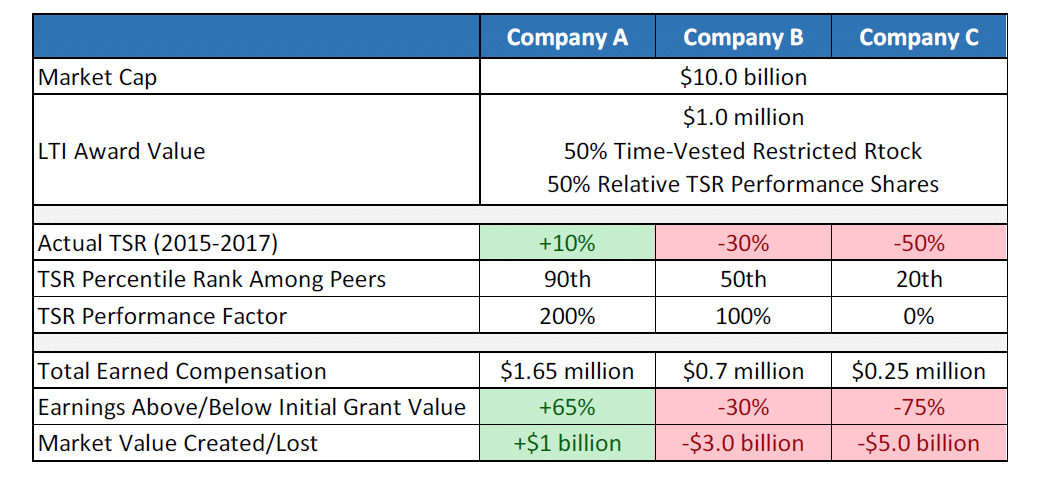
The table below illustrates a common long-term incentive structure of time-vested restricted shares and relative-TSR performance shares across three notional oil & gas companies. The illustrative range of actual shareholder returns (+10% to -50%) is indicative of what we observed across the upstream oil and gas industry for the recently completed 2015-2017 performance period.

Through a typical combination of time-vested and TSR performance-vested shares, the same $1 million award generated significantly different outcomes, aligned with the respective shareholder experience.
Investors have gotten their wish with the many new returns metrics in E&P incentive plans. Stronger pay for performance alignment still stems from the relative performance comparisons and substantial share denomination already present in most long-term incentive programs.
Archived copies of previous Energy Insights can be found at www.meridiancp.com/insights/energy.
