 Jim Heim
In recent years, we have observed a remarkable level of homogenization of compensation practices for non-employee directors, even as what is expected from board members of public companies continues to evolve and – generally speaking – expand.
In our client work, we have also noted a great deal of diversity in the role that the board is expected to perform – both from company to company and, periodically, within the same company over time. Yet this diversity is rarely reflected in board compensation programs.
In this two-part series, we examine the current state of board compensation and whether it accommodates evolving governance practices. Part One summarizes the typical 2019 board compensation pay model and various challenges to this model that are emerging. Part Two will outline factors companies may wish to consider in their next review of board compensation, to ensure that program design and pay levels reflect what is unique about their own business model and governance structure.
Where We Are Today
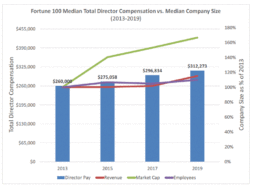
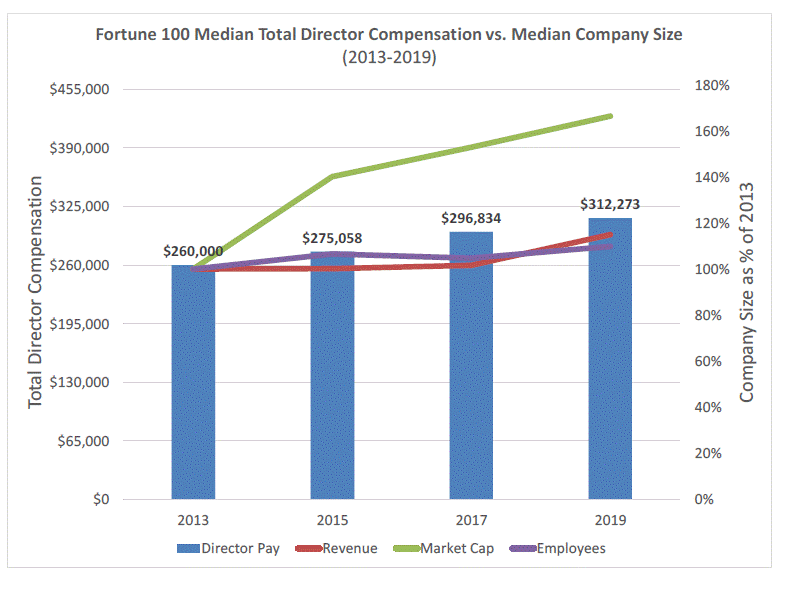
Pay levels have been relatively stable over the past six years. Our internal research specific to the Fortune 100 reveals that median total director compensation for large companies has increased modestly at a rate of 3% per year. This is slightly above the compounded annual growth rate of the companies with respect to revenue and employees, but well behind the recent growth in market capitalization.1

Over this same time period, the interquartile range (the spread between 25th and 75th percentiles) has been shrinking, as the 75th percentile value for compensation has risen at a slower pace than the 25th percentile. Over time, significant board pay outliers are receiving additional scrutiny, including from the proxy advisor ISS, who will target board members who are responsible for setting
director pay when levels are “excessive”. ISS may issue adverse vote recommendations as early as 2020 where director orboard chair pay is regularly in the top 2% to 3% of a defined comparison group.

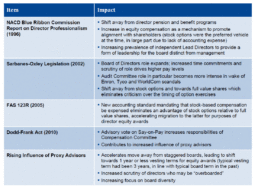
Taking a more long-term perspective, shifting corporate governance practices – influenced by both regulatory developments and the propagation by board associations and proxy advisors of certain practices intended to provide some level of inoculation against claims of board member self-interest – have impacted both the role and compensation of directors. Other environmental factors have also had an influence. Examples include:


The typical board compensation pay model in 2019 reflects these influences, and includes:
■ A mix of compensation weighted at least 50% towards equity, which is awarded on an annual basis in the form of full value shares (restricted stock/RSUs or deferred stock/DSUs) targeting a specific grant value.
■ No board or committee meeting fees.
■ Annual cash retainers for chairing the three most common committees – Audit, Compensation and Nominating/Governance – with the Audit Chair retainer generally the highest.
■ Additional cash retainers for serving as Non-Executive Chair, so that the total cash retainer is roughly double that of other directors.
■ Additional cash retainers for serving as Lead Director, with the premium often sized in line with or slightly higher than the Audit Committee Chair’s retainer.
Is This Compensation Model Tenable Going Forward?
Issue 1: The labor supply may be constrained
Our own 2019 Corporate Governance & Incentive Design Survey of 200 large publicly traded companies found that 69% report a mandatory retirement age for directors. While these retirement ages continue to climb (37% now set the age limit at 75 or older), the single most common retirement age remains 72.
Baby boomers are aging out of the pool of potential candidates. Meanwhile, PWC notes that candidates who are under 50 are in high demand, but also have active careers that may not permit time for outside board service.2
Proxy advisors including ISS are increasingly critical of “overboarded” directors (results from the ISS 2019 Annual Policy Survey suggest that “against” vote recommendations may soon apply when a director serves on more than 4 directorships or an active CEO has more than 1 outside directorship), further narrowing the field of available, experienced directors.
Historically under-represented populations including women and minorities are well-positioned to fill some of this gap. According to ISS Analytics, the percentage of women-held board seats in the S&P 500 now reaches nearly 27%, and women accounted for 46% of the new directorships filled in 2019. Ethnic minority representation is also increasing, but more slowly, with more than 21% of new
directorships in 019 filled by ethnic minority candidates. However, these populations will also be constrained by overboarding standards.
Issue #2: We are asking directors to do more
The NACD finds that the average director commits 245 hours a year to board service, which – while quite an increase over the 191 hour average from 10 years ago – has been relatively stable over the past 5 years. Technology has allowed for more efficient use of time relating to developing and reviewing materials, and less time is spent in travel now that many meetings are held by video- or
teleconference.
However, board members clearly have an expanded remit:
■ Environmental, social and governance (ESG) issues have moved to the front burner and are perceived by many shareholders – including the largest institutional investors – as areas where board oversight is critical to monitor risk and ensure the sustainability of the enterprise.
■ Investors are also demanding more active oversight of human capital, a logical evolution given that intangible assets now account for the majority of the overall asset base at many companies.
■ As technology disrupts many industries, board members are increasingly active in not just reviewing, but helping develop and stress test strategic business plans in response to cybersecurity threats and other challenges.
This expanded scope of responsibility has not been accompanied by larger boards. Spencer & Stuart’s U.S. Board Index, published annually since 1986, indicates that the average S&P 500 board now has 10.8 members, down significantly from an average of 15 in 1986.
Issue #3: There Are Clear Differences in The Role Of The Board From Company-To-Company
While we have been speaking of overall trends and identifying the most typical range of practices, directors who serve on multiple boards will readily share that there is in fact a great deal of variation between companies in terms of the role that board members play.
At one extreme, boards may serve essentially in advisory roles. Stable industries, experienced management teams, and dual CEO/Chairman roles all tend to mitigate the pressure on board members to “fill the gap” with their own contributions. The board’s oversight role is still critical, but the level of activity is less intense.
At the other end of the spectrum, companies navigating either industry- or company-specific transformation with relatively inexperienced management teams often rely far more heavily on board members. These boards function as true partners in both strategy development and execution.
The latter model is particularly prevalent for growth sectors including, for example, pre-commercial biotechs.
What We Would Expect – But Don’t Yet See
Given this fact pattern, we might expect:
■ Overall pay opportunities to increase over time to accommodate a constrained labor pool and expanded demands on board members;
■ An increasing range of board pay opportunities over time in recognition of the diversity of board roles and contributions; and
■ That the materiality of board pay relative to overall enterprise value may increase over time, in recognition of the growing consensus across the investor community view that expanding board oversight is critical to both manage enterprise risk and foster sustainable businesses.
The board pay model appears broken. Part Two of this series will provide suggestions on how it might be fixed.
________________________________________
1 Results have not been adjusted to reflect changes in sample constituents.
