 Andrew McElheran
This update reviews trends in executive pay at S&P/TSX 60 companies[1]. The general trend for the last three years has been for modest growth in actual and target pay, although actual senior executive pay fell slightly from 2013 to 2014. Performance share units (PSUs) continue to increase as a proportion of long term incentive compensation, with a solid majority of companies using relative total shareholder return (TSR) as the performance measure in their long-term plans. However, compensation committees continue to grapple with finding appropriate peer groups and setting three year PSU targets.
S&P/TSX 60 Compensation Changes
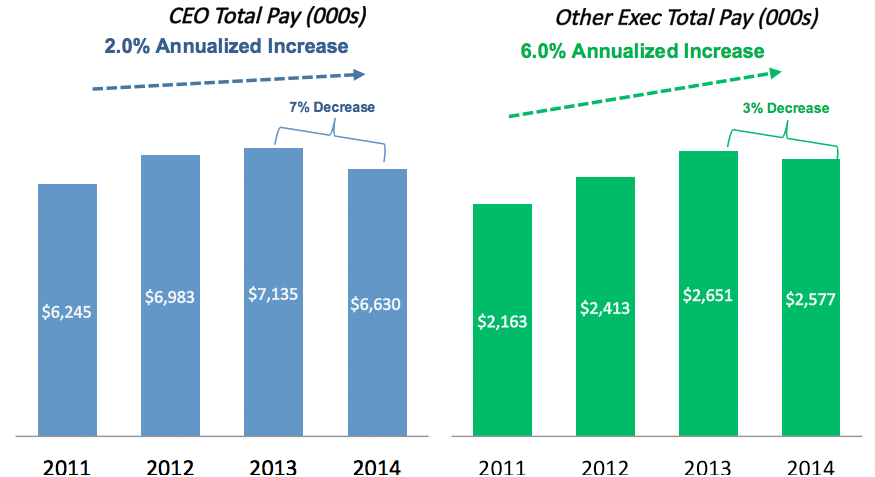
Median CEO “Actual” Compensation Falls 7% for CEOs and 3% for Other Executives
Meridian’s analysis of executive pay at S&P/TSX 60 companies found a slight decline from 2013 to 2014 (reflecting lower bonuses paid for 2014 performance compared to the prior year), but single-digit annualized growth overall, over the last few years.
Distribution of Target Pay Levels, and Mix of Pay
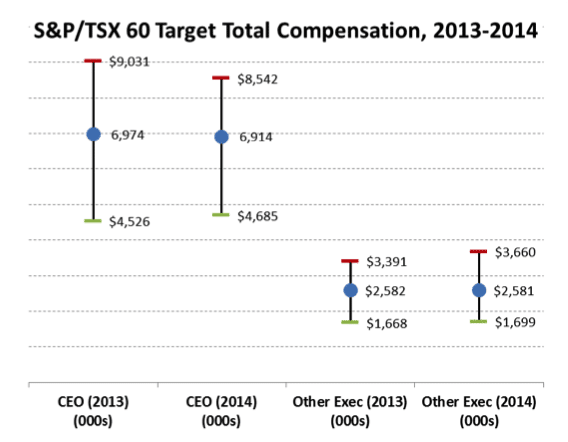
By contrast, target pay levels were flat-to-up slightly between 2013 and 2014, with median CEO pay at $6.9 Mn and median other executive pay at $2.6 Mn (in both cases, less than 1% higher than 2013).
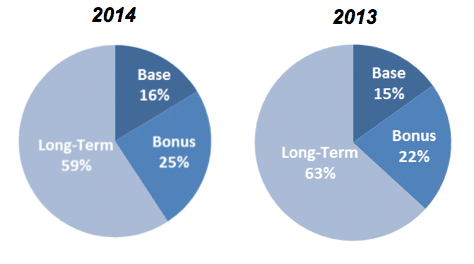
The range of target pay levels remained fairly consistent, year-over-year. The range between the CEO 75th percentile and 25th percentile target pay shrank by about 15%, while the comparable range for other executives grew by about the same amount. The mix of pay was very similar in both years.
Year-Over-Year Trends in Salaries
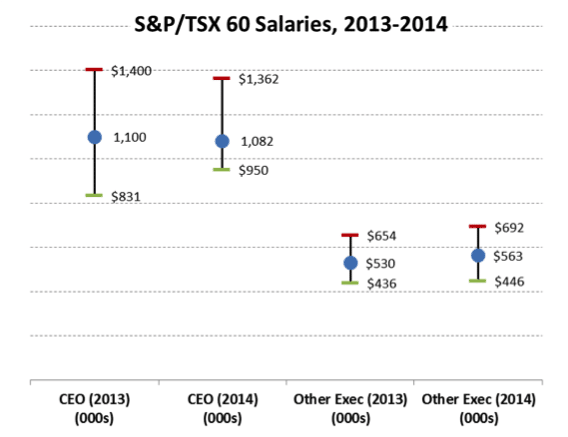
For the past several years we have seen salary increases in the range of 2%-4%. This trend continued between 2013 and 2014. The median CEO salary fell very slightly, but average CEO salaries were up by 4%. For other executives, the average increase was 2%. The chart at right shows the range of salary levels over the last two years. The CEO salary range shrank significantly, likely due to more companies targeting salary to the median of their peer group and the greater emphasis on CEO compensation at risk.
Trends in Target and Actual Bonuses
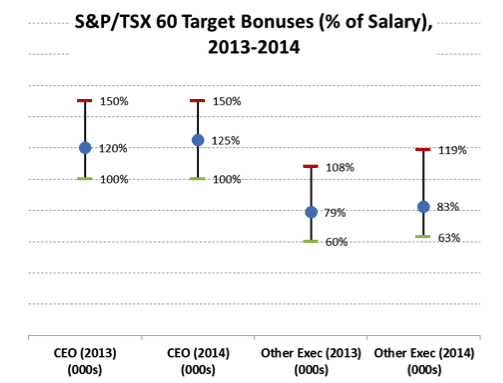
Target bonus opportunities, as a percentage of salary, increased slightly year-over-year. For CEOs, the median target bonus opportunity increased from 120% of salary, to 125%. For other senior executives, incentives increase from 79% of salary to 83%.
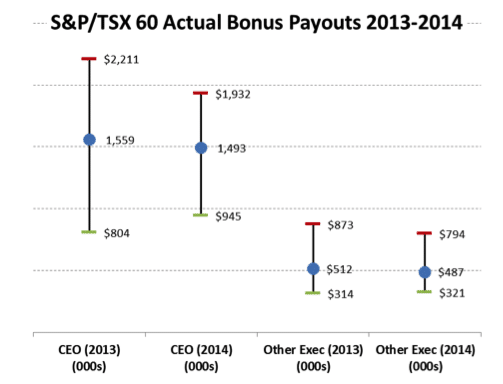
By contrast, actual bonuses, reflecting payouts for 2013 and 2014 performance fell by 5% on average for both CEOs and other executives. At the market 75th percentile the change was more pronounced, with CEO bonuses falling by 13% and other executive bonuses by 9%, likely a direct result of declining natural resource prices and the fall in the Canadian dollar during 2014 which had an impact on annual bonus decisions at many of Meridian’s clients.
The charts below show the range of target and actual bonuses, year-over-year:
Trends in Long-Term Incentive Compensation
A persistent trend for the last few years has been the increase in the use of PSUs as a vehicle for long-term incentive compensation. At U.S. companies, this has been accompanied by a significant decrease in the use of stock options. Option use has not fallen off as quickly at Canadian companies, likely due to the very favourable (to the executive) tax treatment of stock options.
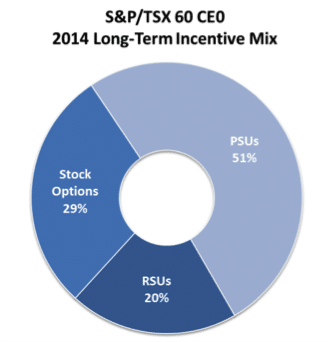
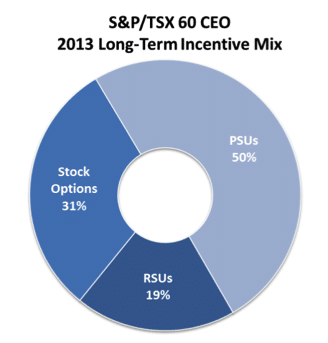
S&P/TSX 60 companies most commonly use two long-term compensation vehicles; a minority (22%) uses three vehicles, and a few (16%) use just one. PSUs have become nearly universal, with more than 90% prevalence, but stock options retain some prominence, with 70% prevalence. However, the weighting given to options is now less than 1/3 of the total long-term incentive value.
One drawback of typical full share unit plans is that they are typically settled in cash or by the purchase of shares on the market. For these plans, the maximum deferral period is three years under Canadian tax rules. As PSUs have become more prevalent, a growing trend is for companies to award share units that are settled in shares issued from treasury. This allows for tax to be deferred until redemption of the share unit (similar to the tax deferral available for options), and well beyond the traditional 3 year period for cash settled awards. Treasury plans must be approved by shareholders, but companies are increasingly using these plans to replace the long term equity that was delivered by options.
As PSUs have increased in prevalence and in weighting, the choice of the most appropriate long-term performance metrics has become more important. The chart below shows the prevalence of PSU performance measures among S&P/TSX 60 companies:
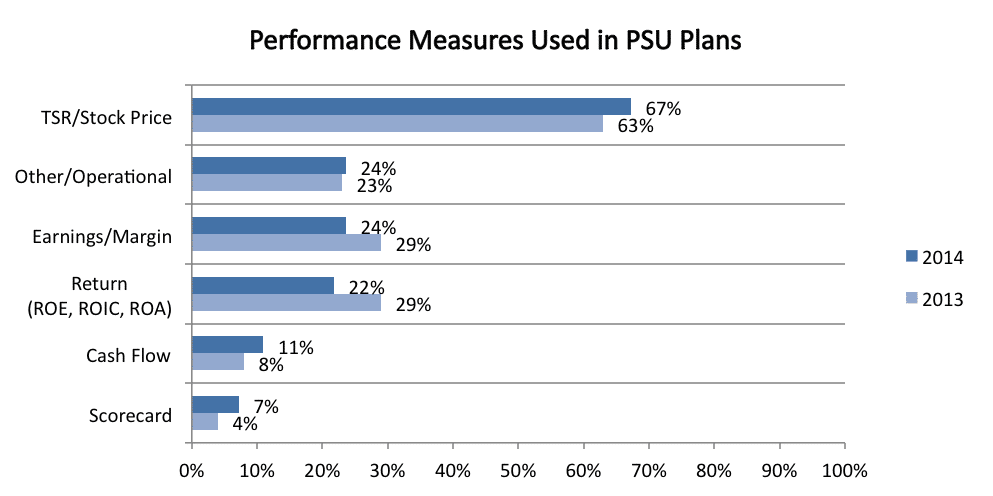
Stock price-based performance measures – mostly relative TSR – are by far the most common. However, for many companies, a relative TSR metric is used in combination with a second metric, such as a return metric, to provide a more balanced approach with improved “line of sight”.
Relative TSR-based plans are designed to pay out at higher or lower levels based on a company’s TSR (stock price appreciation plus reinvestment of dividends) compared to a defined group of companies or companies in an index. Relative TSR plans make sense because:
- The goal-setting burden is greatly reduced – compensation committees do not need to evaluate the degree of difficulty of a goal expressed in absolute terms (e.g., 10% earnings growth), only to decide on the performance required in rank terms (e.g., TSR better than that of at least half of the peer companies earns a target payout)
- Paying managers for TSR performance relative to a peer group or benchmark rewards industry outperformance in a shareholder aligned way (particularly in a down market)
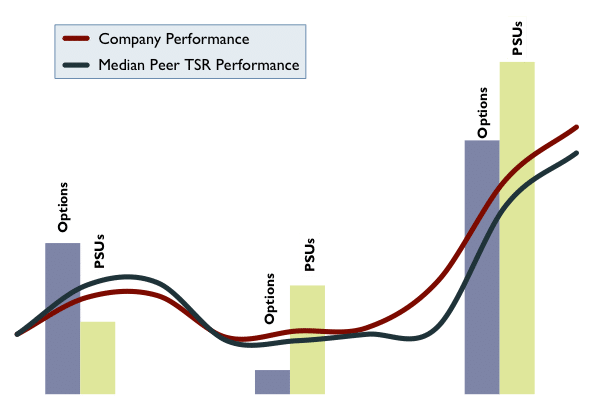
- Unlike stock options, which can increase or decrease in value based solely on broad capital market changes unrelated to company performance, the value of a PSU based on relative TSR depends on outperformance compared to the peer group. The graph below illustrates the difference between option and PSU value in rising or falling capital market scenarios with relative outperformance or underperformance.
The debate over PSU plan metrics is certainly not settled. As managers cannot directly affect stock price, much less the performance of the peer companies, these programs operate more to create shareholder alignment than incentives for management behavior. Many compensation committees continue to debate PSU metrics and to the right balance between relative TSR and absolute financial or operational measures.
What to Expect for 2015
2015 may bring lower or no increases in salaries, as companies try to manage fixed costs in light of the continued low price of oil and low Canadian dollar. Target setting for 2015 has caught up to the market, so incentive awards, at least for higher performing companies, will likely be higher in 2015, returning to more normal levels. We expect the trend to performance share units to continue and that relative TSR will remain a metric of choice. However, companies will pay closer attention to choosing a performance peer group that is correlated with the company’s business characteristics, to allow these awards to truly pay for industry outperformance.
* * * * *
The Client Update is prepared by Meridian Compensation Partners. Questions regarding this Client Update or executive compensation technical issues may be directed to:
Christina Medland at (416) 646-0195, or cmedland@meridiancp.com
Andrew McElheran at (416) 646-5307, or amcelheran@meridiancp.com
Andrew Stancel at (647) 478-3052, or astancel@meridiancp.com
Andrew Conradi at (416) 646-5308, or aconradi@meridiancp.com
John Anderson at (847) 235-3601, or janderson@meridiancp.com
This report is a publication of Meridian Compensation Partners Inc. It provides general information for reference purposes only and should not be construed as legal or accounting advice or a legal or accounting opinion on any specific fact or circumstances. The information provided herein should be reviewed with appropriate advisors concerning your own situation and issues.
[1] This information is from Meridian’s review of circular filings by the companies in the S&P/TSX 60 in the last three years, informed by our consulting experience. No effort has been made to maintain a constant year-over-year sample. Cash compensation data is generally from narrative or tabular circular disclosures without adjustment, except for annualizing part-year data where appropriate. Long-term incentive compensation (stock options and full share units) have been valued at grant date according to Meridian’s proprietary methodology.
